# Loading packageslibrary(plyr) # weighted data analysislibrary(dplyr) # data wrangling library(sf) # spatial data manipulationlibrary(ggplot2) # data visualisationlibrary(spdep) # grid and neighbourslibrary(tmap) # (spatial) visualisationsource(here::here("functions","CEPHaStat_3.R"))
CEPHaStat version  3

CEPHaStat is a collection of R functions produced by the UKRI GCRF
CEPHaS project.  The functions relate primarily to statistical analysis of
soil and related data from agricultural and environmental surveys and
experiments.  The CEPHaStat file can be shared as it stands, and is made
available to all for use, without warranty or liability.
Code
# Loading maize data (Kumssa - GeoNut, 00_cleaning-maize, line 16)# Grain & soil chem datadata.df <-read.csv(here::here("data", "maize", "MWI_CropSoilChemData_CSV", "MWI_CropSoilData_Raw.csv"))
We extracted multiple variables of interest (including the LOD), which served to:
check the NA values (n=427) for maize Se concentration in found in the dataset published in Gashu et al. study (2021).
to add those values as possible solution for accounting for the high number of missing maize Se conc. values.
Due to the high number of BLOD we have generated four Se variables to test sensitivity of the model.
Se_raw: This variable contains the values as reported from the chemical analysis including the values BLOD. Cleaning steps:
No measured: Six Se values were coded as not measured (“NM”) , which were transformed into NA.
Code
subset(data.df, ID %in%c("MWI0574", "MWI1007","MWI1138","MWI1168","MWI1171","MWI1686"), select =c(ID, Crop, Se_grain)) %>% knitr::kable()
ID
Crop
Se_grain
563
MWI0574
Maize
NM
993
MWI1007
Maize
NM
1124
MWI1138
Maize
NM
1154
MWI1168
Maize
NM
1157
MWI1171
Rice
NM
1672
MWI1686
Maize
NM
Negative (or zero) values: 21 values were negative and converted to the smallest limit of detention value (0.002..). We tested to convert it into: zero, which is a problem for a number of reasons, including that zero cannot be log transformed (-Inf.), and to the minimum value in the dataset (0.0009) which again generate problems with outliers, and skewerness.
Se_std: This variable contains Se values as above, however BLOD values were substituted with their respective LOD value (as per each round of test, see Crop_ICP_Run_Se & Se_LOD variable).
Se_grain: This contains the Se values reported above the LOD, where values BLOD were excluded (i.e., converted into NA), as was previously done by Gashu et al., 2021 and reported in the “MWI_CropSoilData_NA.csv” dataset in Kumssa et al, 2022.
Additionally, the MAT values were added to this dataset for each sample location (i.e., GPS coord.), as this study only reported analytical values carried as part of the GeoNutrition project. These values were completed when extracting the MAT for the Chilimba et al. (2011) sample locations.
4.1.1 Spatial preliminary analysis
The missing (i.e., BLOD values) are spatially clustered, which probably will influence (unbalancing) our results (Kumssa et al, 2022). We hypothesised that this is due to high concentration of very low maize grain Se concentration values likely driven by soil and environmental factors in those affected regions ((ref?)).
Although, the samples collected provided a good coverage of Malawi, there were 2200 EAs without a maize Se conc. samples. In addition, low number of maize samples were found in the southern region of Malawi (Shire Valley), leading to a more scarce and, probably higher uncertainty in that region. Moreorver, consumption of maize in that region is comparable with the other regions of Malawi, and probably the main reason for the lower maize values is that the harvest season is slightly earlier than in other regions of Malawi (probably due to difference in the climatic patterns), and hence maize was not found when the field team were there to collect the data.
In order to minimise the impact on our model, and after checking that maize consumption is the same as other regions in Malawi (even slightly higher), we decided to explore other datasets which led to the inclusion of maize samples from Chilimba et al. study (2011) (see data section & next section).
4.2 Mineral concentration in maize (Chilimba et al., 2011)
Code
# Loading maize data (complementary) (Chilimba, 00_cleaning-maize, line 16)maize <- readxl::read_excel(here::here("data", "maize","AllanChilimbaFieldData_forLucia_20230615.xlsx"), sheet =1)
This dataset provided Se concentration in maize grain and pH in soil (measured in water) in the same locations, however it did not contain information on the MAT (BIO1) for each location, which are used for the maize aggregation model (see _02modelling).
We extracted the variable of interest, removed NA and checked the coordinate projections to make sure both datasets (GeoNutrition & this dataset) were compatible (both datasets provided longitude and latitude data in decimal degrees, WGS84 datum, coordinate reference system EPSG:4326).
Code
#Renaming variable & adding info on data sourcenames(maize)[c(23, 28)] <-c( "Se_mg", "pH_w")maize$survey <-"Chilimba"# Getting variables of interest 1:12 (sample descript), grain_se and pHmaize <- maize[,c(1:11, 23, 28, 56)]# Checking values sum(is.na(maize$Se_mg)) # Only 2
[1] 2
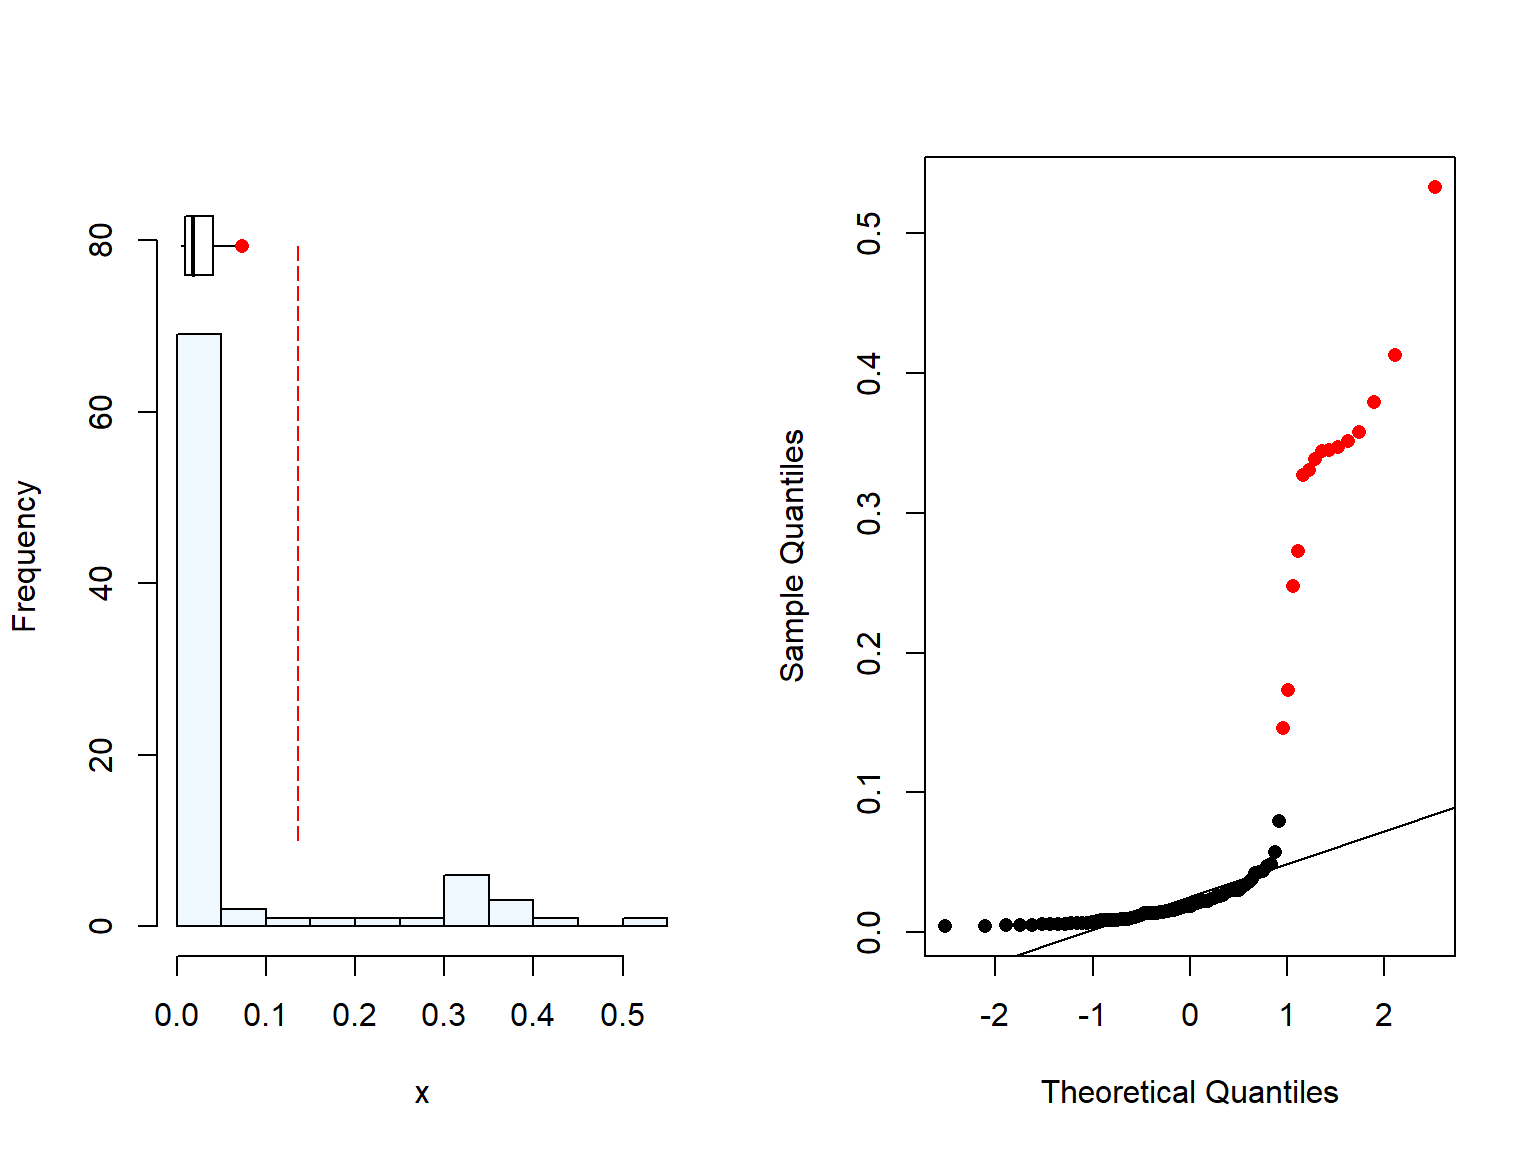
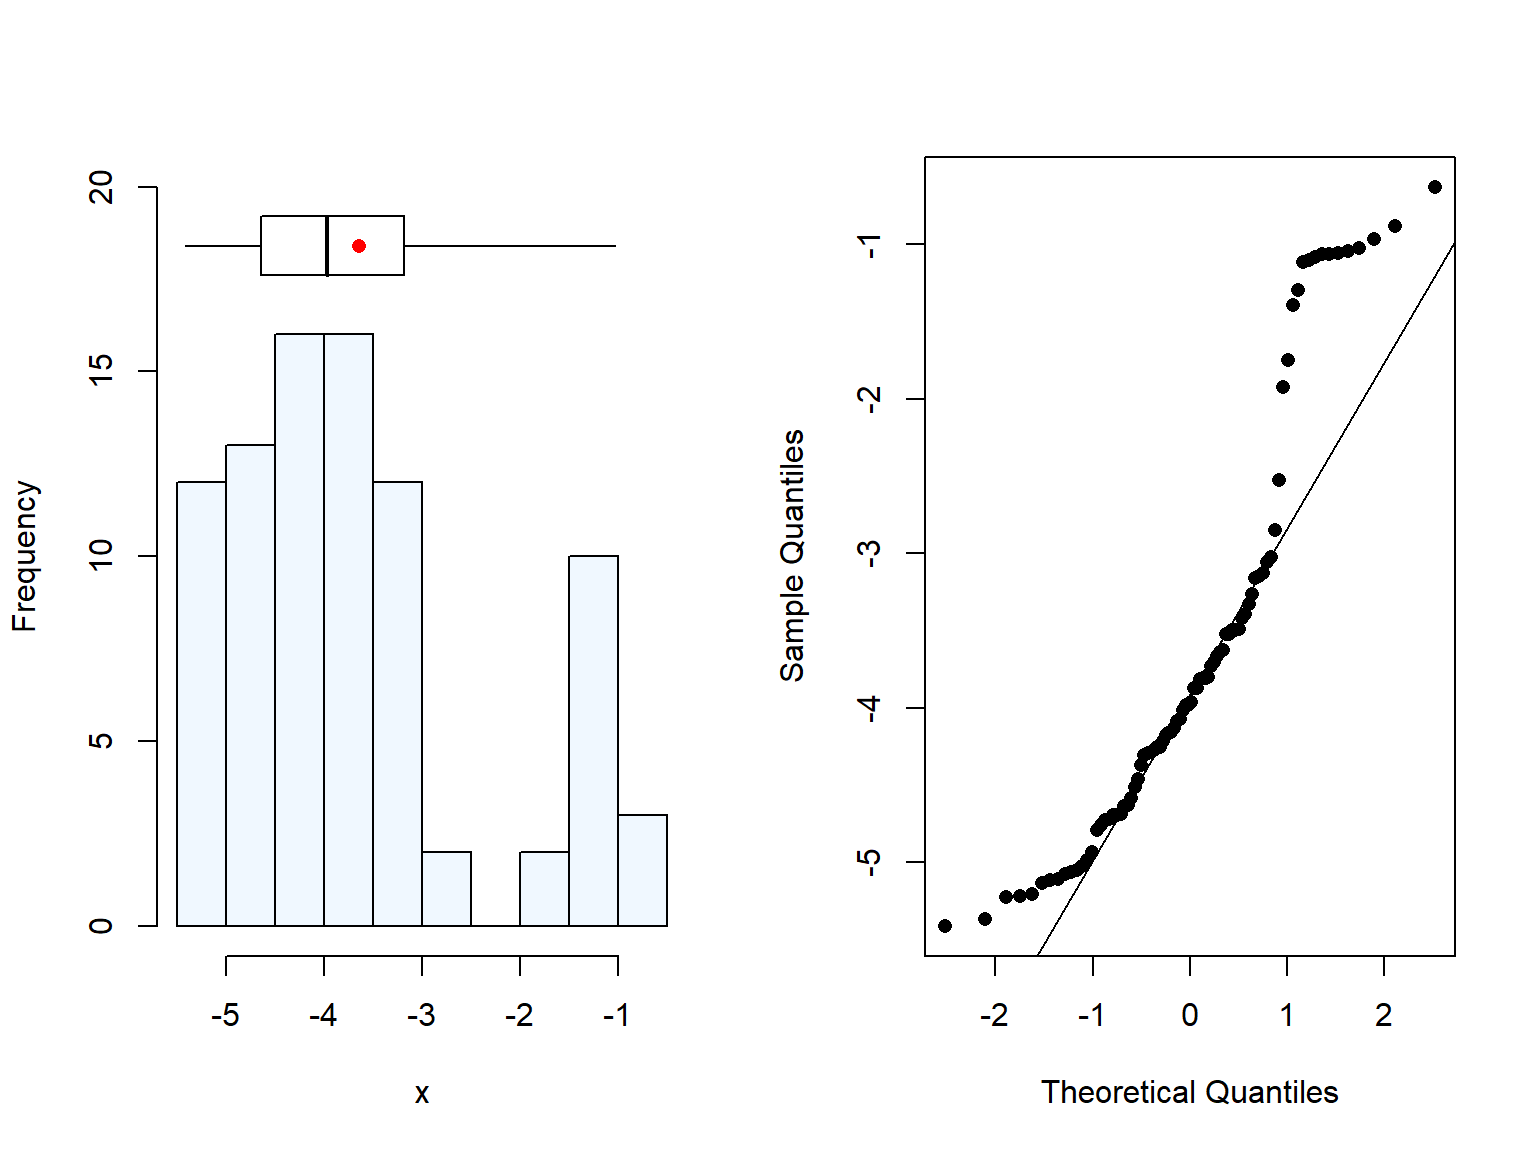
When we checked the distribution of the sample (Figure 4.1, Figure 4.2), we can see that the log-distribution shape is a bit odd. This may be related to the majority of the samples were collected from high maize Se conc. areas (i.e., Shirey valley), which, paired with probably the omission of BLOD values, led to a large number of high concentration values.
Code
summaplot(maize$Se_mg)
[1] 2 missing value(s) removed
Figure 4.1: Distrubution of maize Se concentration from the study of Chilimba et al. (2011).
Code
summaplot(log(maize$Se_mg))
[1] 2 missing value(s) removed
Figure 4.2: Distrubution of log transformed maize Se concentration from the study of Chilimba et al. (2011).
4.3 Excluded datasets
Here, we provide information about the data exploration and main reasons for exclusion of the datasets.
4.3.1 GeoNutrition (Gashu et al., 2021)
This dataset was excluded because high percentage of values were transformed to NA some of which were BLOD values for maize Se concentration. However the cleaning scripts are provided in this repository.
We extracted the variables of interest from the dataset: Se conc. (only in maize), pH, MAT, and the coordinates. Then we are doing some data operations, for instance, removing NAs (values >999) in Se conc. and checking missing values for the covariates.
Two pH values were missing, hence we may exclude those values for the modelling, also there were three locations with missing MAT. This could be have been completed when extracting the MAT for the Chilimba et al. (2011) sample locations.
4.3.2 Mineral concentration in crops (Joy et al., 2014)
This study was excluded because it did not provided substantial information (i.e, only few new samples), while it would potentially add more uncertainity to the final results. The script for cleaning the dataset is provided in this repository.
This study collected data for various crops, hence we needed to clean the dataset to obtain only the information for maize Grain. We also excluded maize flour to keep it consistent with our dataset. In addition, soil pH values were extracted to be used as model covariates.
One limitation of the dataset is that the GPS location were only provided for crops and not for soils, hence we were trying to use some information (STable10) to combine the sample number with the soil samples. These led to the correct allocation of a pH value for 57 of the 155 samples.
According to the documentation, soil samples were not taken when the samples were collected at the market. We are then assuming that samples without pH value were collected at the market and hence should be excluded from our analysis. Then, only one or two samples were collected in the Shire Valley, thus this sample dataset will not be contributing substantially to reduce the uncertainty, and it may add other sources of variability (i.e., temporal, analytical, etc). Hence, it was excluded from the final dataset.
4.3.3 Mean Annual Temperature
Mean Annual Temperature (MAT) was used as environmental covariate for the aggregation of maize Se model. The data was extracted from the CHELSA dataset which was downloaded from here on 2023/07/17 and cropped for Malawi for easy usage. The geographic coordinate system are referenced to the WGS 84 horizontal datum, with the horizontal coordinates expressed in decimal degrees.
4.4 The combined dataset: Crop Se dataset
When we combined both GeoNutrition (Kumassa et al, 2022) and Chilimba datasets, as expected, the maize Se concentration is heavily skewed and it would need log transformation, while pH has a normal distribution.
For more information on that see the exploratory analysis and the variable selection for the model reported in Gashu et al., (2019) (ref?) and the analysis done by Lark et al. (2019), here are the scripts.
4.4.1 Limitations of the maize data
High proportion of below limit of detection values: The number of below detection limit values of selenium (Se) in Malawi were high (~25%) due to the very low Se concentration in maize found in the country which in turn would highly affect our final results. Therefore, some considerations were taken and were explained in the data exploration (Chapter 2) as well as in the modelling section (Section 3.x). See also notes in Kumssa et al. (2022). Potential risk of bias:
High uncertainty of the results leading to potential over-estimation (or under-) of maize Se concentration.
If data were excluded, a) the values would not be missing at-random as they have a spatial pattern (i.e, particular areas of the country were affected mostly), b) left-censoring data set which mean/median overestimation of maize concentration.
Low maize data availability in Southern Malawi region: We found mostly other crops (e.g., millet, sorghum, etc.) (~11%) were collected in Southern Malawi instead of maize. It could be because the harvest season is slightly earlier in that area and hence the fields were already harvested and other crops planted when the data collection happened ((ref?)). This led to the inclusion of another datas set to increase the maize samples in that region, which it has its own limitation (see next point).
Different sampling time For the Chilimba study, the samples were collected during 2009/10 while the GeoNutrion are much recent (2018). This may lead to differences in the composition of the maize due to environmental factors (e.g., rainfall) that may influence the results. Testing for sensitivity (e.g., excluding those data point).
Kumssa, D. B., A. W. Mossa, T. Amede, E. L. Ander, E. H. Bailey, L. Botoman, C. Chagumaira, et al. 2022. “Cereal Grain Mineral Micronutrient and Soil Chemistry Data from GeoNutrition Surveys in Ethiopia and Malawi.”Scientific Data 9 (1, 1): 443. https://doi.org/10.1038/s41597-022-01500-5.